
Ensure a nice-looking Counter Product Display

Stock Management
1/
6
Learning Objectives
The Shift Supervisor and Trainer should work towards achieving the below learning objectives during the on-top training & practice-on-shift culminating in a passed validation.
Learning Objectives: Lean how to carry out a stock counts, deliveries and understand how to optimise Waste.
1. Master Stock Handling & FIFO – Learn to execute stock counts, deliveries, stockroom structures, and apply "First In, First Out" for efficient stock management.
2. Follow Store Task Deadlines – Ensure accurate stock counts and deliveries to prevent shortages or excess waste.
3. Maintain Counting Accuracy – Avoid overcounting or undercounting to maintain correct stock levels and minimize errors to maintain waste below 3%.
4. Ensure Delivery Compliance – Verify temperature, quality, and quantity of received goods, and report discrepancies properly.
5. Utilize the Waste Ladder – Follow structured steps to systematically reduce waste through stock management and team training.
Introduction
One of the most important tasks when managing a store is Stock Handling. Keeping a tight stock control with Delivery and Count is fundamental, as it creates the foundation for a well-functioning store. This area is controlled by the tool called Store Task. It is at all times the Store Manager’s responsibility to execute the tasks, but the Shift Supervisor should be able to fill in for the Store Manager, following the exact same structures. As a part of the Shift Supervisor training, the prospect should do a minimum of 2 deliveries and 2 counts with the Trainer.
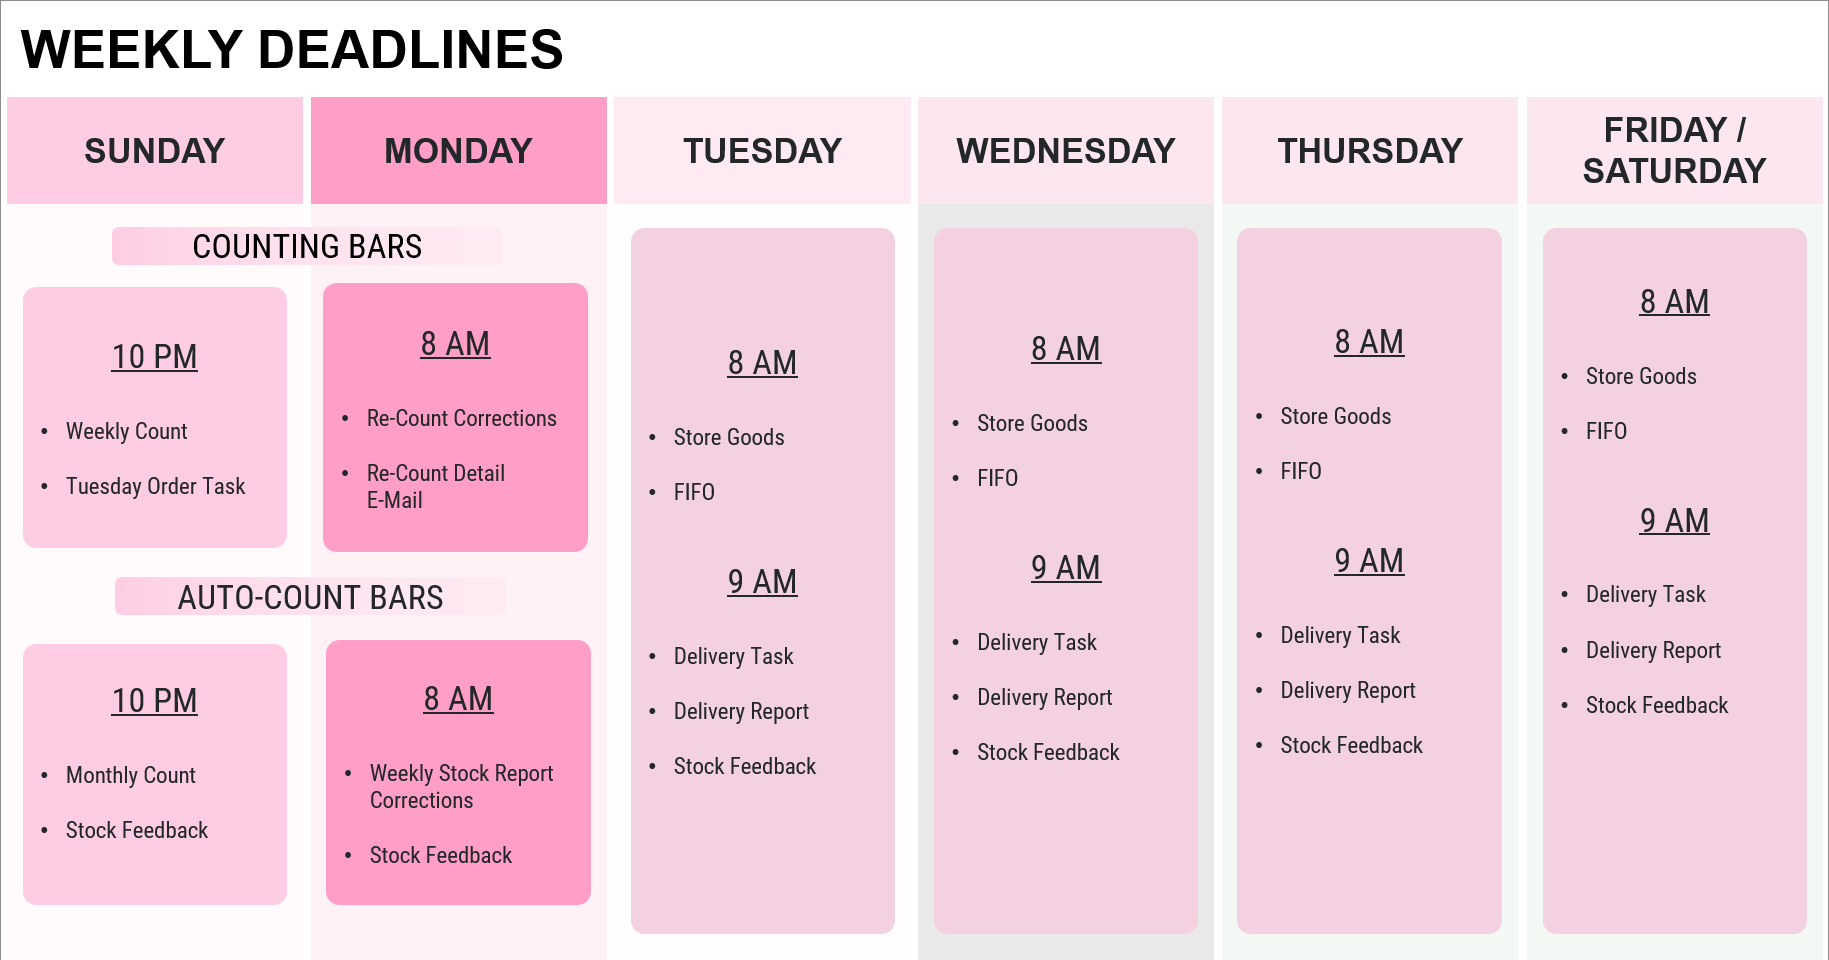
Store Task Deadlines
Deadlines for counts and deliveries are critical to ensure timely orders for the store. Missing these deadlines can result in incorrect orders. During training, your trainer will explain all Store Task deadlines. It's important to document them for easy reference. If you struggle to meet these deadlines, inform the Purchasing Manager via email.
FIFO
FIFO, or "First In, First Out," is essential for maintaining a healthy stock. Here's how to implement it effectively:
- Clearly indicate where goods are located in the bar and stockroom for easy access.
- Store all items in one designated area to prevent confusion.
- Prioritize using items from displays first, then refill.
- When prepping food, place the oldest items at the top for use first.
Out of stock on-shift
If the store runs out of ingredients during a shift, the following procedure must be followed:
- Tap out the affected products on The List to ensure they cannot be ordered in-store, via the app, or through third-party platforms.
- If possible, contact nearby stores to arrange a store transfer.
- Notify the STM that the ingredient is out of stock. It is now the STM’s responsibility to boost the Ideal or place an extra delivery order.
Common Issues & Solutions
Out of Stock
- The first thing to do is to reach out to InventoryEC@joejuice.com to inform the Supply Chain team that you are out so we can explore recovery options ASAP.
- To plug the gap in the short-term, initiate a Store Transfer from another bar that has enough product, such that the transfer won’t put them at risk of running out also.
- Determine the cause of the outage by investigating the data points available. Was there a large amount discarded? Shorted on a delivery? Turnover increasing?
- Using the information learned, correct the in-store issues or confirm with Supply Chain that the ideals need to be increased.
Overstocked
- Ideally prevented through communication, sudden drops in TO as well as incorrect counts or ideals can lead to overstock.
- Inform the Supply Chain team that your Order quantities over-reach your storage capacity when you see you’re going to be sent more than is needed.
- Request a pickup from the supplier if product is unopened and re-sellable. Do not discard things intended for pickup.
- Transfer extra goods to a neighboring store to ensure they get used before expiring.
Delivery Issues
- Missing/Wrong/Expired Item(s): Submit Delivery Reporting form by 12 PM local time to ensure feedback is given to supplier. If they can recover it, they will.
- Late or Missing Delivery: Reach out to Supply Chain team ASAP so we can contact the distributor and evaluate the situation.
- Drop Location Issues: Reach out to Supply Chain with instructions on where you want product to be put. All frozen/prepped product should be stored in coolers.
- Careless Driver: In addition to the Delivery Reporting form, please e-mail Supply Chain with a detailed account of the issue so we can take it directly to the account manager.
Misc.
- Employee Meal Registration: If you wish to know if an employee registered or paid for any consumed products, reach out to Supply Chain.
- Storage Concerns: If you require items to(re)organize the stockroom such as shelving, dollies, etc., please reach out.
- Broken Equipment: If, for any reason, a cooler breaks down and goods cannot be moved out before they expire, we can re-assign the cost to not affect the Waste%.
- POS/List App Issues: Most often, these can be resolved by updating the apps to the latest versions on the iPad(s). If issues persist, file an IT ticket linked off WP2.
IMS Sheets
Find your markets IMS Sheets here
Validation Checklist
Find your markets Validation Checklist here
Delivery
The Importance of Structured Deliveries
Stock handling involves two key parts: counting and deliveries. Sloppy deliveries disrupt store workflow and can lead to increased waste. Timely reporting ensures all needed goods arrive. The main goal of stock handling is to avoid shortages and waste.
Store Task Explained
Tasks like counting, order confirmation, and delivery confirmation happen on our internal website, Store Task. Your trainer will give you access and guide you through the Store Task Guide to learn how to use it. Moneyball tag on WP2 will create access to store task. They will be able to see their stores operational responsibilities on WP2 are aligned.
When receiving a delivery, three tasks are crucial:
- TEMPERATURE: Ensure goods are within the allowed temperature range - By using the pyrometer
- QUALITY: Check for damage, spoilage, and note any issues in Delivery Reporting - For a full (Bad/Damaged) case mark as “received” in store task and report with pictures of goods and label in delivery reporting.
- AMOUNT: Confirm delivery matches Store Task and invoice to maintain accurate stock and avoid overpayment.
Refer to the Hygiene Manual for correct storage guidelines and temperature information.
Delivery Reporting
Delivery reporting is crucial for the Purchasing Manager to track each delivery. It ensures:
- Timely delivery.
- No damaged goods.
- Receipt of all ordered items.
- No extra items received.
Even if everything is correct, the report must be filled out after each delivery to confirm no further action is needed.
This report is used to enforce delivery times with our distribution, no data or incorrect time stamps might impagt consistency of your delivery times.
Sequence Of How To Take a Delivery
When receiving a delivery, follow this sequence:
- Start with frozen goods, meat, and milk products to maintain temperature.
- Use the invoice to tick off each item received, ensuring accuracy.
- Distribute items for fridges like produce.
- Handle dry stock and items for transport wagons.
- All products needs to be stored in canteens and marked with day-date labels
- Update Store Task to confirm receipt.
- Complete Delivery Reporting, noting any discrepancies with the delivery.
- Clean up, disposing of trash and cardboard.
- Resume normal opening procedures.
Input Ideal cooler structure from + Ideal dry goods structure from.
IMS Sheets
Find your markets IMS Sheets here
Validation Checklist
Find your markets Validation Checklist here
Count
The Importance of Correct Counts
For efficient stock management, we use a counting system. Accuracy is crucial to avoid disruptions. Mistakes in counting can lead to incorrect deliveries, causing shortages or waste:
- COUNTING TOO MUCH: Excess counted items won't be delivered, causing shortages and guest dissatisfaction.
- COUNTING TOO LITTLE: Insufficient counts result in excess deliveries, leading to waste.
Evaluating the Stock & Give Feedback
Before distributing goods from the delivery, it's crucial to assess stock levels. Is there an excess of certain items? Are others running low or out of stock? While the Store Manager is responsible for stock ideals, Shift Supervisor assist in monitoring and suggesting improvements.
COUNTING:
Counting is vital for waste management and informs weekly usage. It's essential to be thorough and follow these principles:
- Stay calm to avoid mistakes.
- Maintain organization to prevent misplaced items.
- Enter correct units.
- Double-check counts and compare with previous weeks.
- Follow these rules:
- Same person counts weekly.
- Count at the same time each week.
- Follow the same sequence: Stockroom - Back of House - Bar.
- Begin stockroom count 1-2 hours before closing, with no goods taken afterward.
- Don't count bar stock until after closing.
- Avoid estimating; count accurately.
- Do not use decimal of a case or pack unless there is no other option.
Final Remarks
Fixing a bad streak of either waste numbers or incorrect counts takes time. It cannot be done in just a week. Two consecutive perfect counts are required in order to create the foundation for accurate numbers. Furthermore, keeping nice structures and following the type in culture on both employee meals and waste consistently is key to success!
COUNT OVERVIEW ILLUSTRATION:

Counting serves two key purposes:
- Determining the goods needed for the next delivery.
- Showing the leftover stock at the week's start.
The count done the following week serves two roles:
- Calculating the Waste Percentage, indicating how much is left after a week of sales.
- Providing a starting point for the next week's count, emphasizing the importance of consistent accuracy over time.


After the upload is performedMonday morning, the Supply Chain team will send out a report outlining theuploaded count.
The manager must then, using thereport, correct the counted amounts on the listed items to what’s trulyon-hand.
The report focuses on items that are deemed to be low on stock as well as key ingredients to aid in making corrections.
No real threshold for difference reporting, more of a common-sense thing. High usage items will have the biggest discrepancies and those will need the most attention due to over usage on key items like apples/cucumbers/banana/chicken/avocadoes/strawberries.
SPEED is the focus on the WSR. Only large discrepancies need to be changed – the purpose of this report is to correct the count enough so that the orders aren’t way off.
No KPIs are calculated off this data, we only use actual counts.
Re-count
After the count is completed and confirmed, the Purchasing Manager will give feedback regarding which quality of count was done in each store. The reason for this is to identify possible mistakes and correct them before it is too late when these mistakes will have an impact on your delivery and waste percentage. The re-count sheet consists of 5 different types of mistakes:
- NO USAGE = If the same quantity of a good has been counted as last week. This cannot be true as a whole week of sales and usage has passed.
- ZERO STOCK = When you have no stock left of a specific good. Either it is out of stock or you forgot to count the item. Both outcomes are not good.
- TYPE IN MISTAKE = A clear mistake which is normally due to wrong quantities typed in (example 120 boxes of avocado instead of 120 pcs).
- RECOUNT = Significant over or under usage. This can be due to Juicers not following recipes or a poor type in culture.
- NEGATIVE USAGE = You have more in stock of a specific good this week compared to last week’s count + delivery. This should not be possible.
Re-counting is a crucial tool used by the Purchasing Manager to ensure accuracy in stock counts and minimize errors affecting waste percentages. It involves comparing what came in (deliveries) with what went out (sales, employee meals, waste) since the last count.
The Re-count Cycle:
- Start with Inventory Count A, followed by a delivery.
- Throughout the week, track sales, employee meals, and waste.
- End the week with Inventory Count B, which forms the basis for the next count.
- Inventory Count B becomes the starting point for the next week's count, continuing the cycle.
It's essential to accurately track all consumption, sales, and waste to maintain an effective re-count cycle and minimize errors. Mistakes can take up to 2 weeks to rectify, impacting both re-counts and waste percentages negatively.


Checklist
Find your markets Checklist here
IMS Sheets
Find your markets IMS Sheets here
Validation Checklist
Find your markets Validation Checklist here
Waste
Refers to discarded food costs weekly, focusing solely on overused goods.
Example: If a stockroom on Monday contains:
- 10 boxes of Apples
- 20 Mighty Juice Cups
- 20 Mighty Juice Lids
- 20 Straws
- 5 whole Bananas
- 1 bag of Strawberries
Throughout the week, 20 Mighty Pick Me Ups are sold, each requiring one box of apples, 5 bananas, and a bag of strawberries as per the product manual. If by Sunday, there are 9 boxes of apples left, the waste percentage would be 0%.

To maintain minimal waste, ensure the following:
- Begin the week with an accurate count and end with a perfect count.
- Receive deliveries correctly with no missing, damaged, or extra goods.
- Prepare products strictly according to the product manual.
- Input employee meals accurately on the POS.
- Minimize waste due to expiration or spoilage.
- That's it - achieving 0% waste!
However, deviations can occur:
- Missing goods or incorrect orders increase waste.
- Deviations from the product manual add to waste.
- Moldy goods or improper storage contribute to waste.
A waste percentage of 0-3% is optimal, considering potential spoilage. Focus on minimizing waste of expensive items like strawberries and avocados.
The calculations for the Auto-Count uploads are quite simplistic, and for them to remain accurate over the course of the four-week cycle, the store needs to execute on IMS when making products BTC.
Controlling these 3 things (IMS falls under usage) means uploads are spot-on, or at least close enough.
There are always slight discrepancies between the uploaded count and reality, because there are always variances in IMS and type-in.
Things that can impact an upload:
- Excessive over-usage from not adhering to IMS
- Discarding products and notentering them into the WasteApp
- Failing to sign ‘Receive’ Store Tasks (Buy-in)
- Failing to Type-In GF Bread, add-ons, and substitutions into the POS
The Weekly Stock Report allows us to catch these errors before they can have an impact on orders. Side note; ONLY used for order quantities, not waste% calculations. Mention reporting differences.
Important Areas Affecting Your Waste
Supervisor and managers are responsible of ensuring all employee meals are typed in and accounted for.
Store Tasks are crucial for minimizing waste, but four other aspects also impact waste:
- Employee Meals: All team consumptions should be entered in the POS. Failure to register leads to inaccurate waste data.
- IMS (Ingredients, Measurement, Sequence): Non-compliance with IMS results in perceived over-usage, affecting waste metrics.
- Waste iPad: Utilize the Waste feature to track and understand reasons behind high waste percentages. It doesn't affect overall waste but aids in tracking and analysis.
- Ideals: Purchasing Manager sets stock ideals, dictating quantities needed until the next delivery. Failure to meet ideals can lead to over-ordering and increased waste.
- Ideal prep + Prep IMS How much you prep + following the prep guides
- Type in on POS, ensuring all add-on’s customizations are accounted for
- Store transfer: both incoming and outgoing strore transfers NEED to be accounted for.

The Purchasing Manager controls all stock ideals and adjusts them regularly based on your feedback. Ideals vary throughout the year, with more goods ordered during busy seasons like summer. Your input is vital as you work in the bar daily and can provide valuable insights. For instance, if your bar sells more Signature Juices, you might need extra cucumber and kale. This feedback helps the Purchasing Manager order accurately.
Reflecting on ideals is best done the afternoon before or the morning of a delivery, allowing you to assess current stock levels.
- Increase ideals for goods running low.
- Decrease ideals for goods in excess.
In standard rotation, use delivered goods within 2-3 days. If used after 5-6 days, ideals may be too high; if used immediately, ideals may be too low. Maintain a stock buffer for unexpected events.
Ensure enough stock is on hand to last the day upon delivery receipt. Gradually adjust ideals when overstocked to prevent sudden shortages. More drastic changes are acceptable when specific goods are running out.
Assuming all other data points(start count, buy-in, POS sales) are correct, this calculated count represents what your count would be if all products were made with perfect IMS.
For example, if a store regularly fails to enter Gluten-Free Bread on the POS when requested by a guest, the system will not account for that usage and there will be two issues:
- The uploaded count on GF Bread will be higher than what’s in the store, which means it will not be ordered when itis needed.
- The uploaded count on regular Bread will be lower than what’s in the store, leading to more bread than needed being ordered.
Since there are always IMS discrepancies, we also send out a Weekly Stock Report which serves as a Re-Count for the upload. This consolidates all tasks onto Monday morning.
Other accuracy points:
Delivery Reporting so we get credits for missing goods
Store Transfer registration

Example with Banana, Kiwi, Chicken, Basil, and Apples for a residential store (not high turnover store):
Stock Status:
- Bananas: Increase ideal by 10 bags.
- Kiwi: Decrease ideal by 30 pieces.
- Chicken: Decrease ideal by 7 bags.
- Basil: Increase ideal by 6 bundles.
- Apples: Increase ideal by 7 boxes.
To Change Ideals:
- Contact Regional Manager with exact amounts and reasons.
- Specify which delivery the changes apply to.
- Request changes before Friday 12:00 for the following week.
- Review ideals every 3-4 weeks and reflect weekly.
Waste Ladder
Whenever your store is not performing on waste, you can as a Supervisor look into specific steps of the Waste Ladder in order to reach a waste percentage below 3% which essentially is every store’s goal:
- Step 1 – 4 are tasks that you as a Store Manager only can perform by doing your main tasks well.
- Step 5 – 7 are tasks that you as a Store Manager only can perform by teaching your team the correct behavior and following up.

- Stock Count: Ensure accurate counts to maintain waste control.
- Ideal Adjustment: Verify ideal stock levels to prevent overstocking and waste.
- Delivery Check: Confirm received goods match orders to prevent missing items being labeled as waste.
- FIFO & Fridge Structure: Organize stock for easy access and minimize waste.
- IMS Training: Train staff on IMS rules to reduce overuse of ingredients.
- Waste Reporting: Encourage team to use waste reporting tools consistently.
- Employee Consumption: Educate staff on logging consumed items to prevent unnecessary waste.
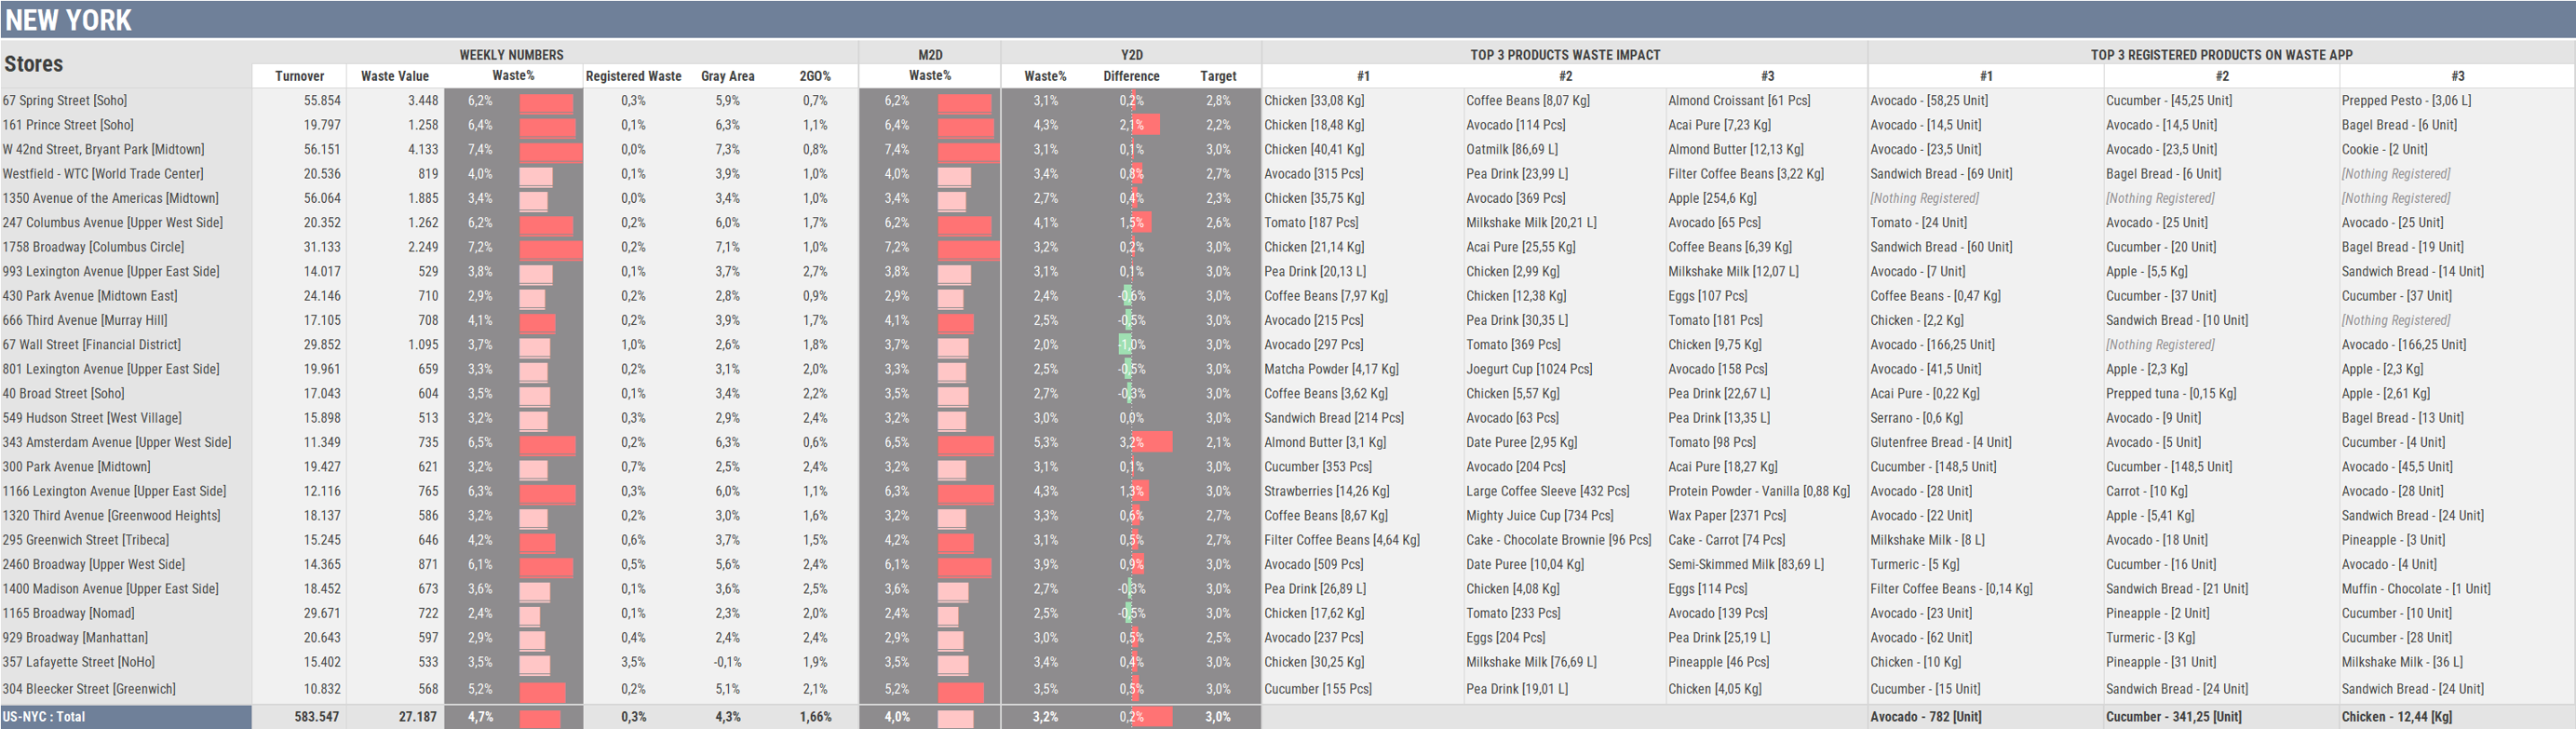
Manager Waste Report
Turnover: The value of all sales for the period, in USD.
Waste Value: The value of all discarded, over-used, or otherwise ‘missing’ goods for the period, in USD.
Waste%: Waste Value divided by Turnover.
Registered Waste: The percentage of the Waste Value that was accounted for in the Waste App.
Grey Area: The portion of the waste% that was not accounted for in the Waste App. More Waste App usage will shrink the Gray Area.
M2DWaste%: The average weekly waste% since the start of the month. The first week of each month will show very little (if any) deviation.
Y2DWaste%: The average Waste% since Jan 1 of this year.
Y2DDifference: The difference between the actual Y2D waste% and the target waste%.
Y2DTarget: This is the waste% level that the store must perform at to hit their budget target for the year. If the bar is already on-target or below budget, it will show the usual target of 3%.
Top 3 Waste Impact: Self-explanatory, top 3 items contributing to the total waste%
Top 3 Registered Products on Waste App: The 3 ingredients most frequently discarded and registered in the Waste App this week.
Availability & Type-in Report
OOS: Total tap-outs for the week, minus full-list tap-outs
Key: Chicken, tuna, tomato, ginger, pineapple, etc.
Minor: Spirulina, raw cacao
Base: Apple, cucumber, bread, 2%, espresso (?)
Top3 Tap-Outs: Most frequently tapped out items; review DCWF and ideals.
Average Employee Meals per Shift: The number of registered employee discounts for the week – including free coffees – divided by the number of shifts for that period. If each employee enters 1 product into the POS per shift, this would be a 1. Lower ratios indicate loss – and thus increased waste% - from employees consuming products but failing to account for them in the POS. Higher ratios indicate strong type-in culture and accountability.
Negative Counts: The number of items counted in a quantity that is higher than last week’s count plus last week’s buy-in. The target is 0; anything over 5 is a strong indicator that the start count, end count, or buy-in was incorrect.


.png)


IMS Sheets
Find your markets IMS Sheets here
Validation Checklist
Find your markets Validation Checklist here


How to videos

IMS Sheets
Find your markets IMS Sheets here
Validation Checklist
Find your markets Validation Checklist here

Closing Tasks
Deep Clean Centrifuge

Closing Tasks
Espresso Machine Cleaning
IMS Sheets
Find your markets IMS Sheets here
Validation Checklist
Find your markets Validation Checklist here
Cleaning Tasks

Clean Bar Bins

Clean Bar Lamps + Speakers

Clean Bar Front

Clean Bar Filters

Clean Seating and Tables

Clean Trash Bins in Customer Area

Clean Cleaning Tools

Clean Drains

Clean Floor Panels

Clean Walls and Pictures

Clean Fridges

Clean Dishwasher

Clean Sinks

Deep Clean Stockroom + Fridges

Deep Clean Mythos

Deep Clean GB5
Transport Wagons
Bar Cabinets
How to handle Cleaning Detergents

Dishwasher Detergent
Cafiza
Multipurpose
IMS Sheets
Find your markets IMS Sheets here
Validation Checklist
Find your markets Validation Checklist here


Prev
13/
6
IMS Sheets
Find your markets IMS Sheets here
Validation Checklist
Find your markets Validation Checklist here