
Execute re-stock

Brilliant Basics
1/
4

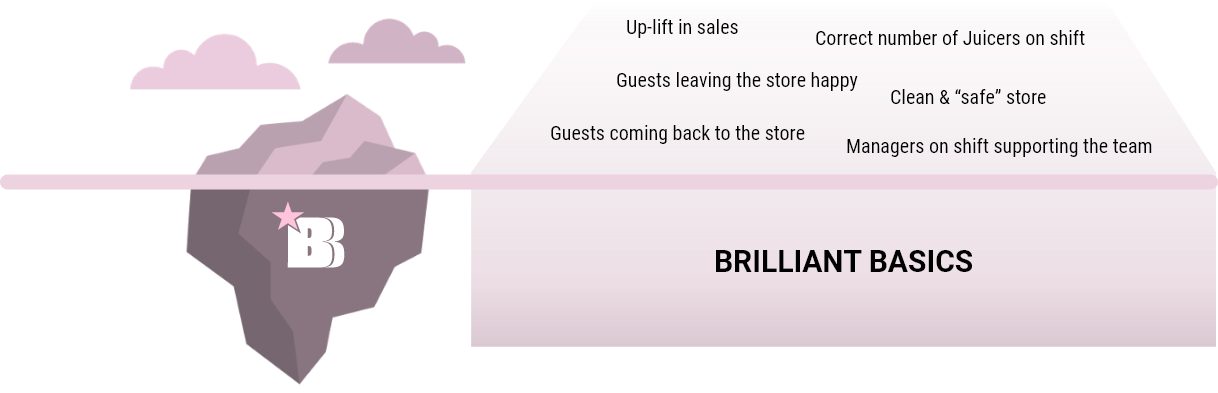
What Is Brilliant Basics?
Brilliant Basics is JOE & THE JUICE’s global execution standard. It defines what great looks like in every store.
The 3 pillars of Brilliant Basics are:
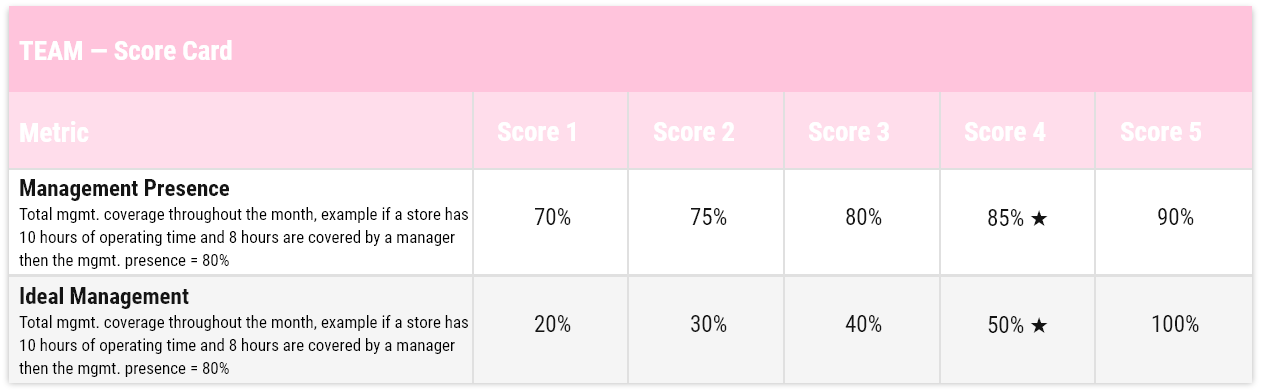
- Team: how the store leadership shows up
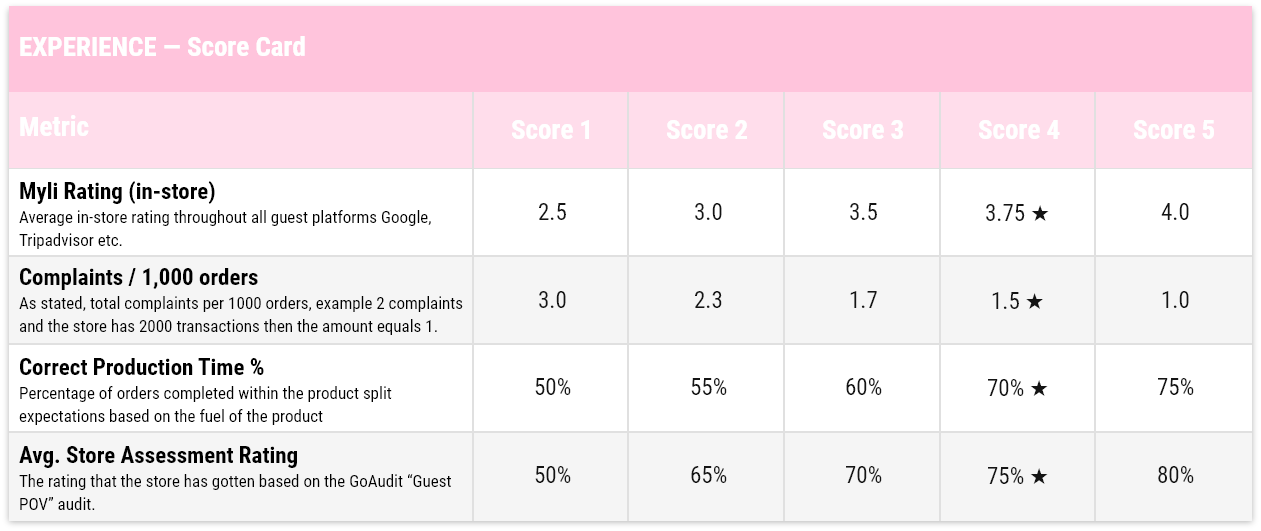
- Experience: How the guest feels
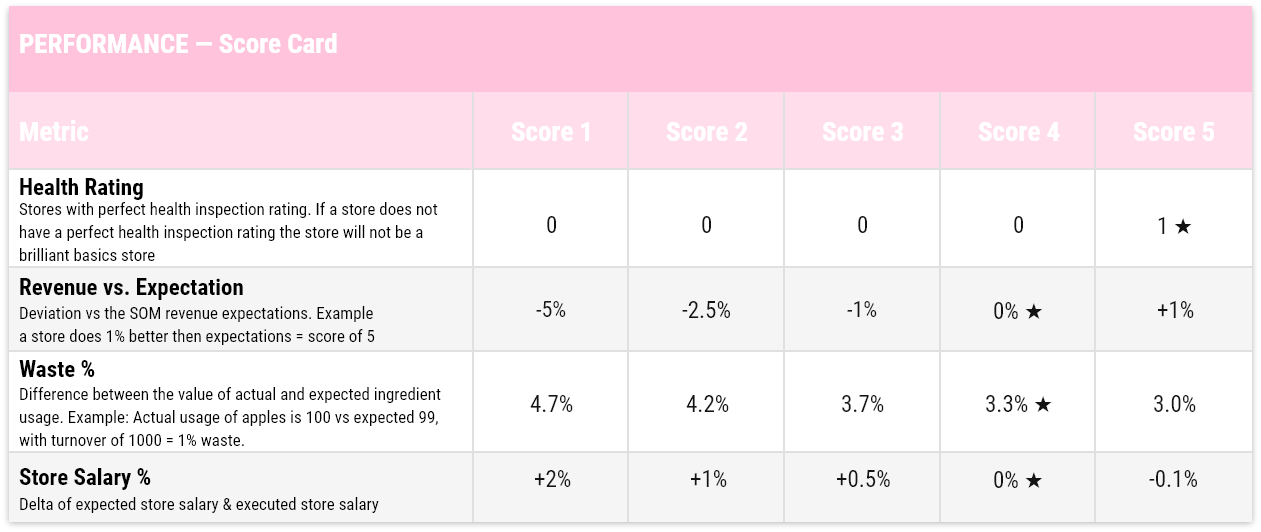
- Performance – how the store performs
Why Brilliant Basics Matters
For the past years, focus has been heavily on operational KPIs. Brilliant Basics brings experience back to the forefront, without losing performance control. Running a successful Joe & the Juice store requires a broad skillset and overview of various performance indicators. Brilliant Basics is our one source of truth which gives a snapshot of how our stores are performing.
Delivering the basics is about doing the rights things consistently over time, even though the result isn’t showing right away. Once the structures, routines and efforts are in place, it will show in the daily performance of the store:
Brilliant Basics store is our common focus across the company, and various operational initiatives will be launched during the year.
All with one aim = Making all Joe & The Juice stores a Brilliant Basics store
The Brilliant Basics Score Card
Each store is evaluated on a 1–5 scale on three parameters: Experience, Performance, and Team. Each parameter consists of equally weighted sub-parameters that are evaluated on a 1-5 scale. Stores that achieve an overall score above 4.01 earn Brilliant Basic status.
The Brilliant Basics Dashboard
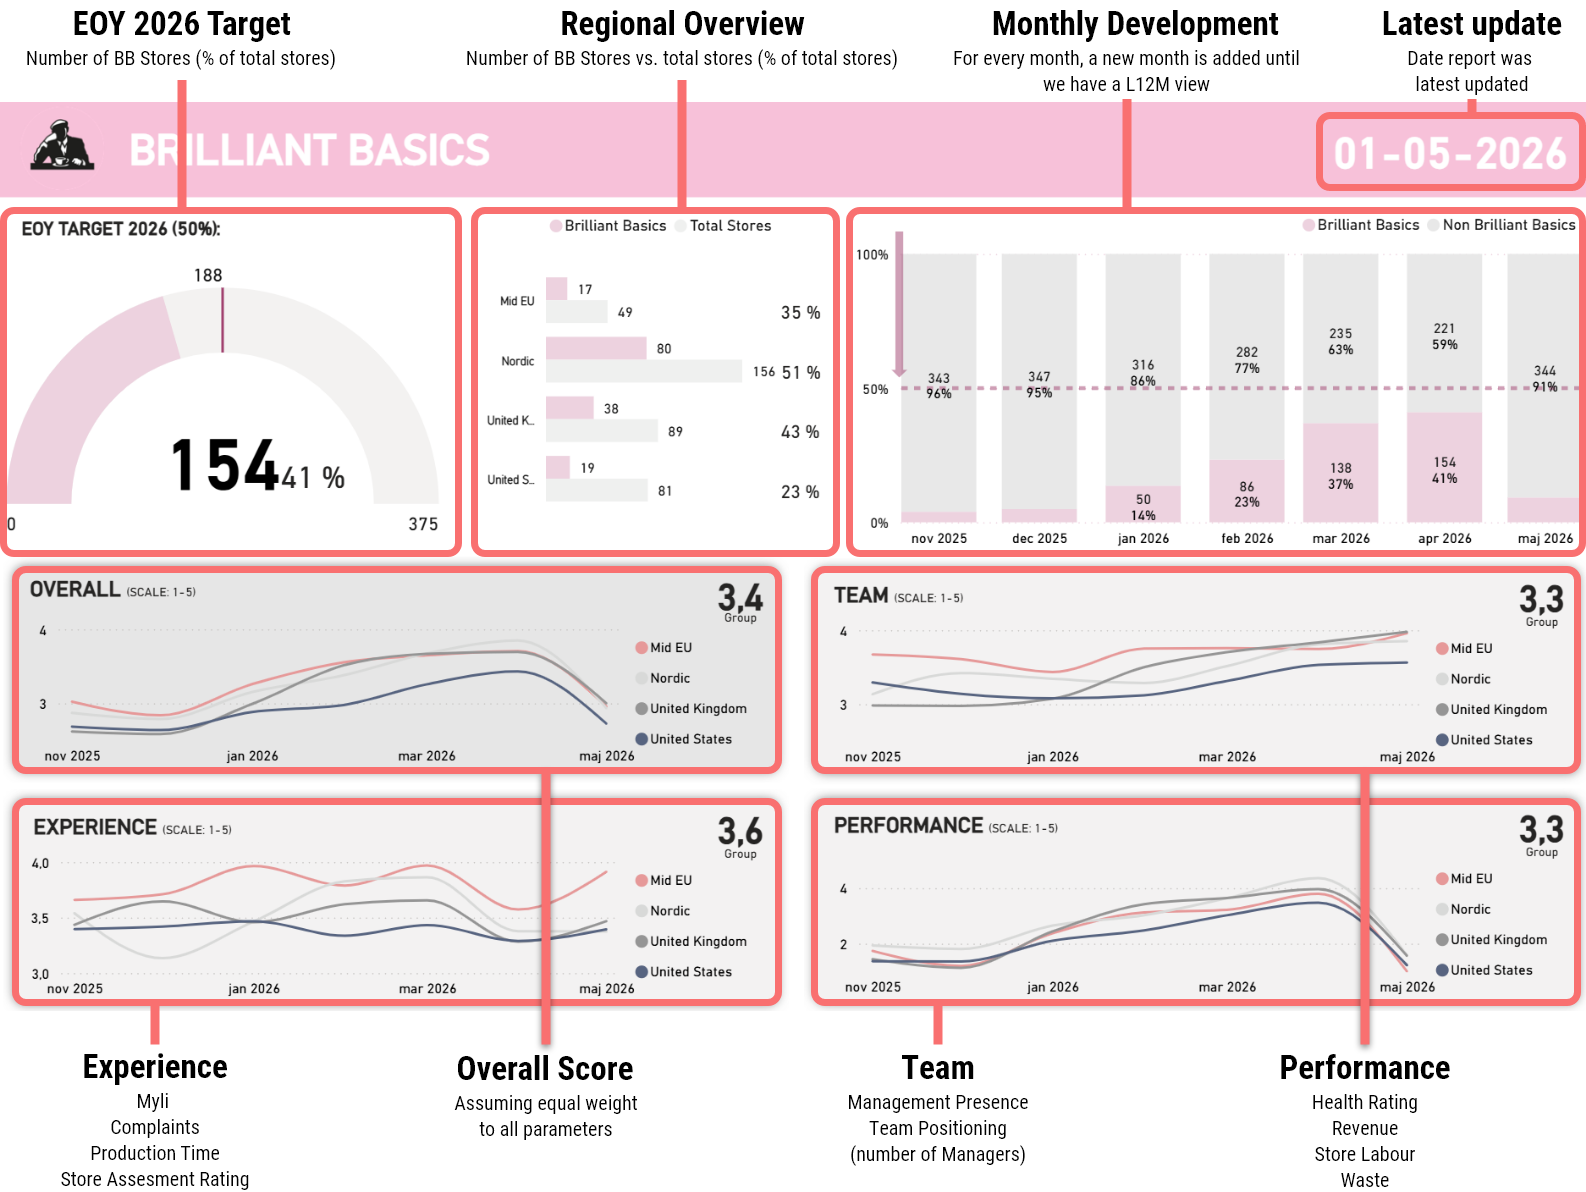
The Brilliant Basics Dashboard gives leaders a complete performance snapshot for every store, updated monthly. It is the single source of truth for tracking progress toward Brilliant Basics status.
The dashboard is structured across three leadership levels:
Top level: Regional Leadership
The Regional Overview shows the number of Brilliant Basics stores versus total stores per region, displayed as a percentage. Regional leaders use this to track overall health and prioritise where to focus.
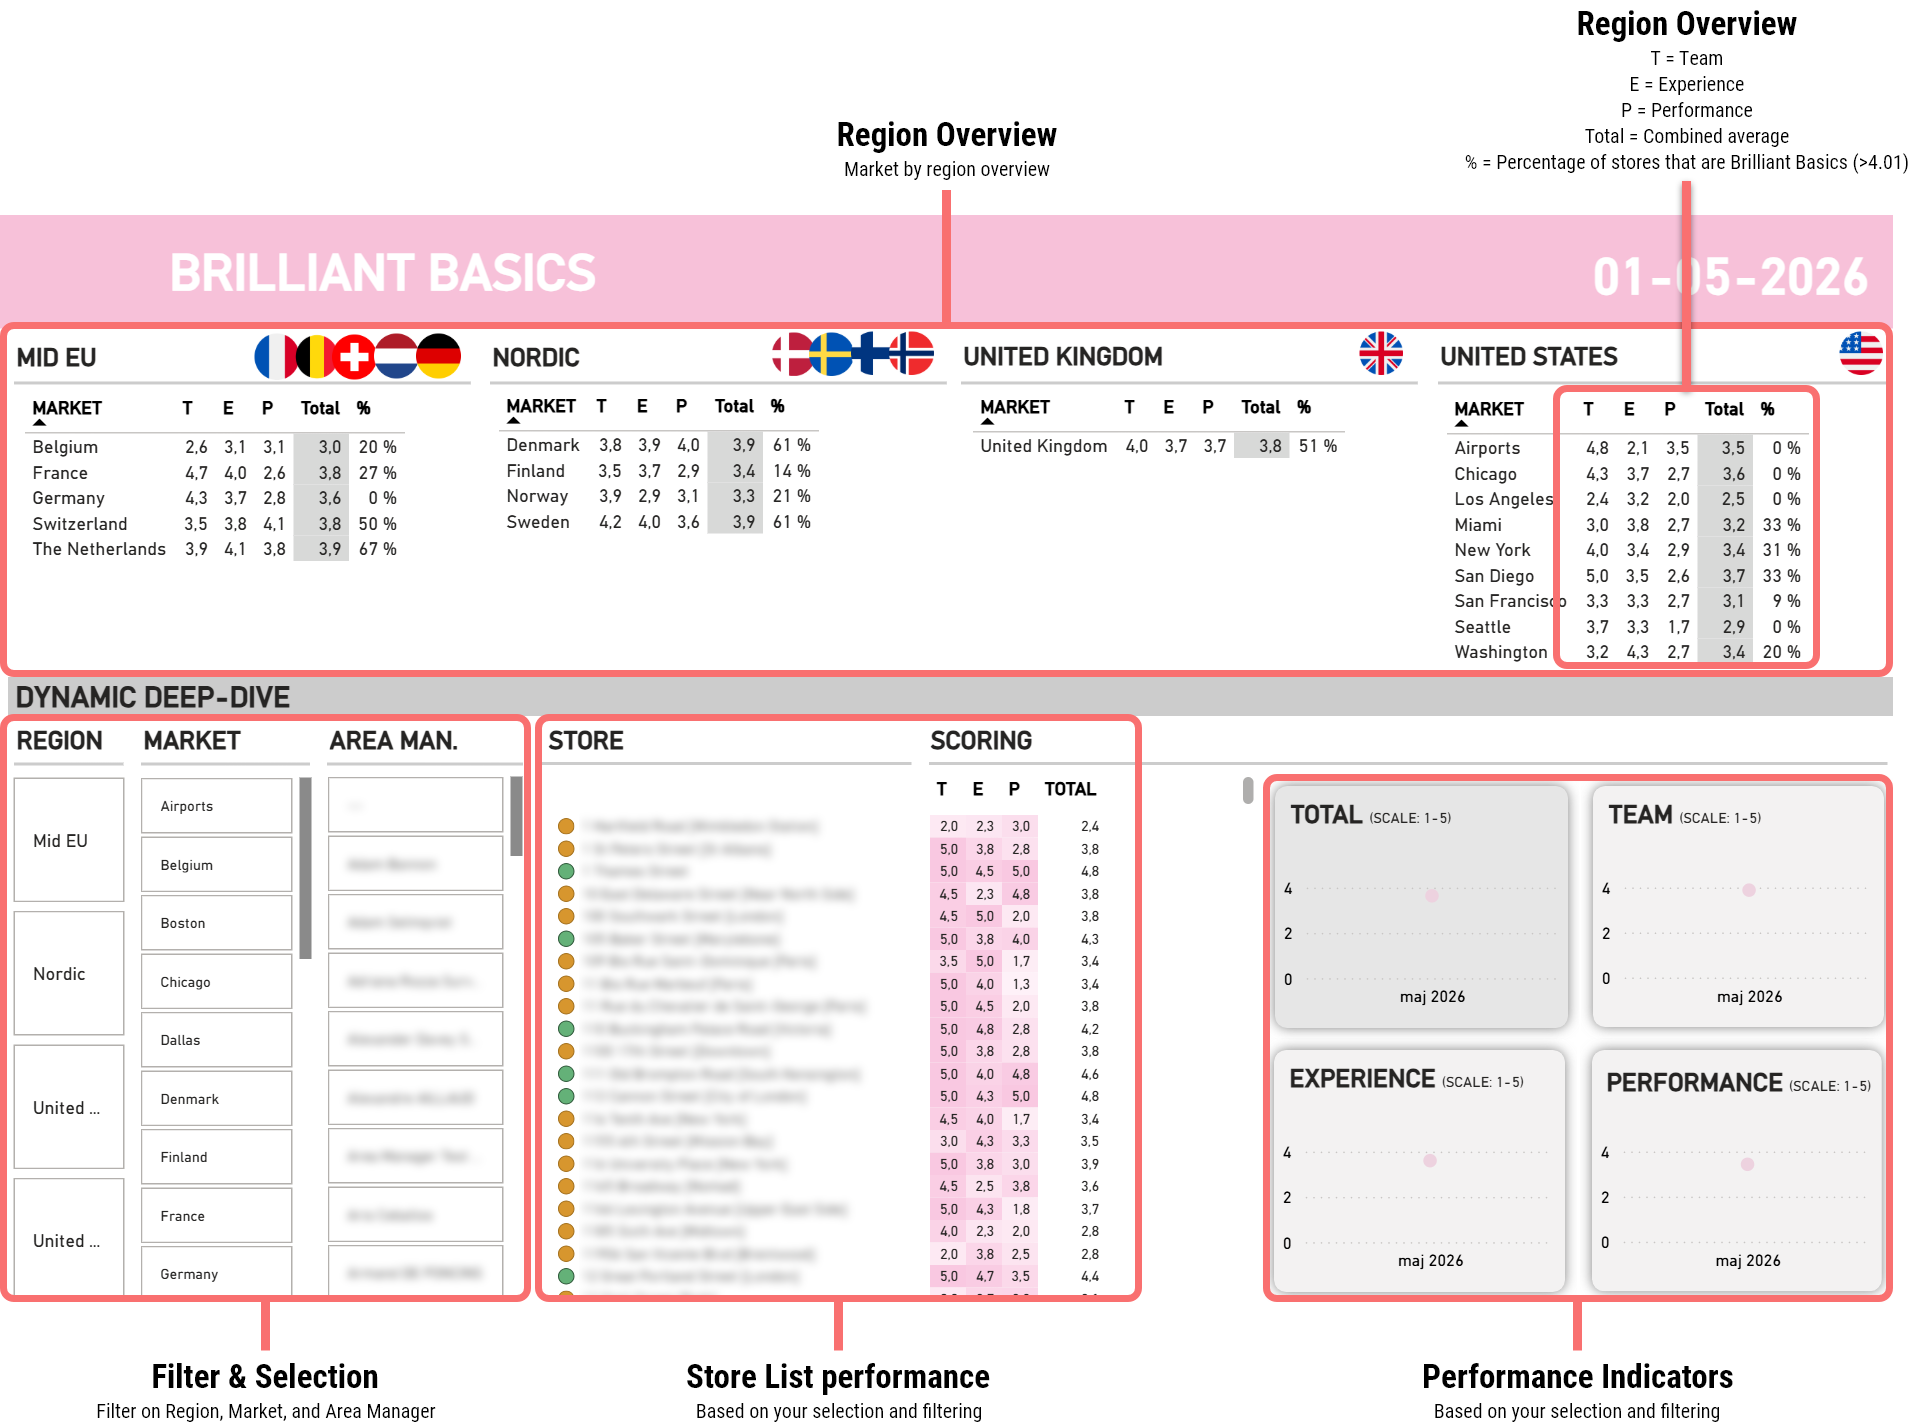
Mid Level: Market Leadership
The Market Level Overview allows market leaders to drill down into individual stores within their market. It highlights which stores are close to hitting 4.01, which are struggling, and where the biggest gaps are.
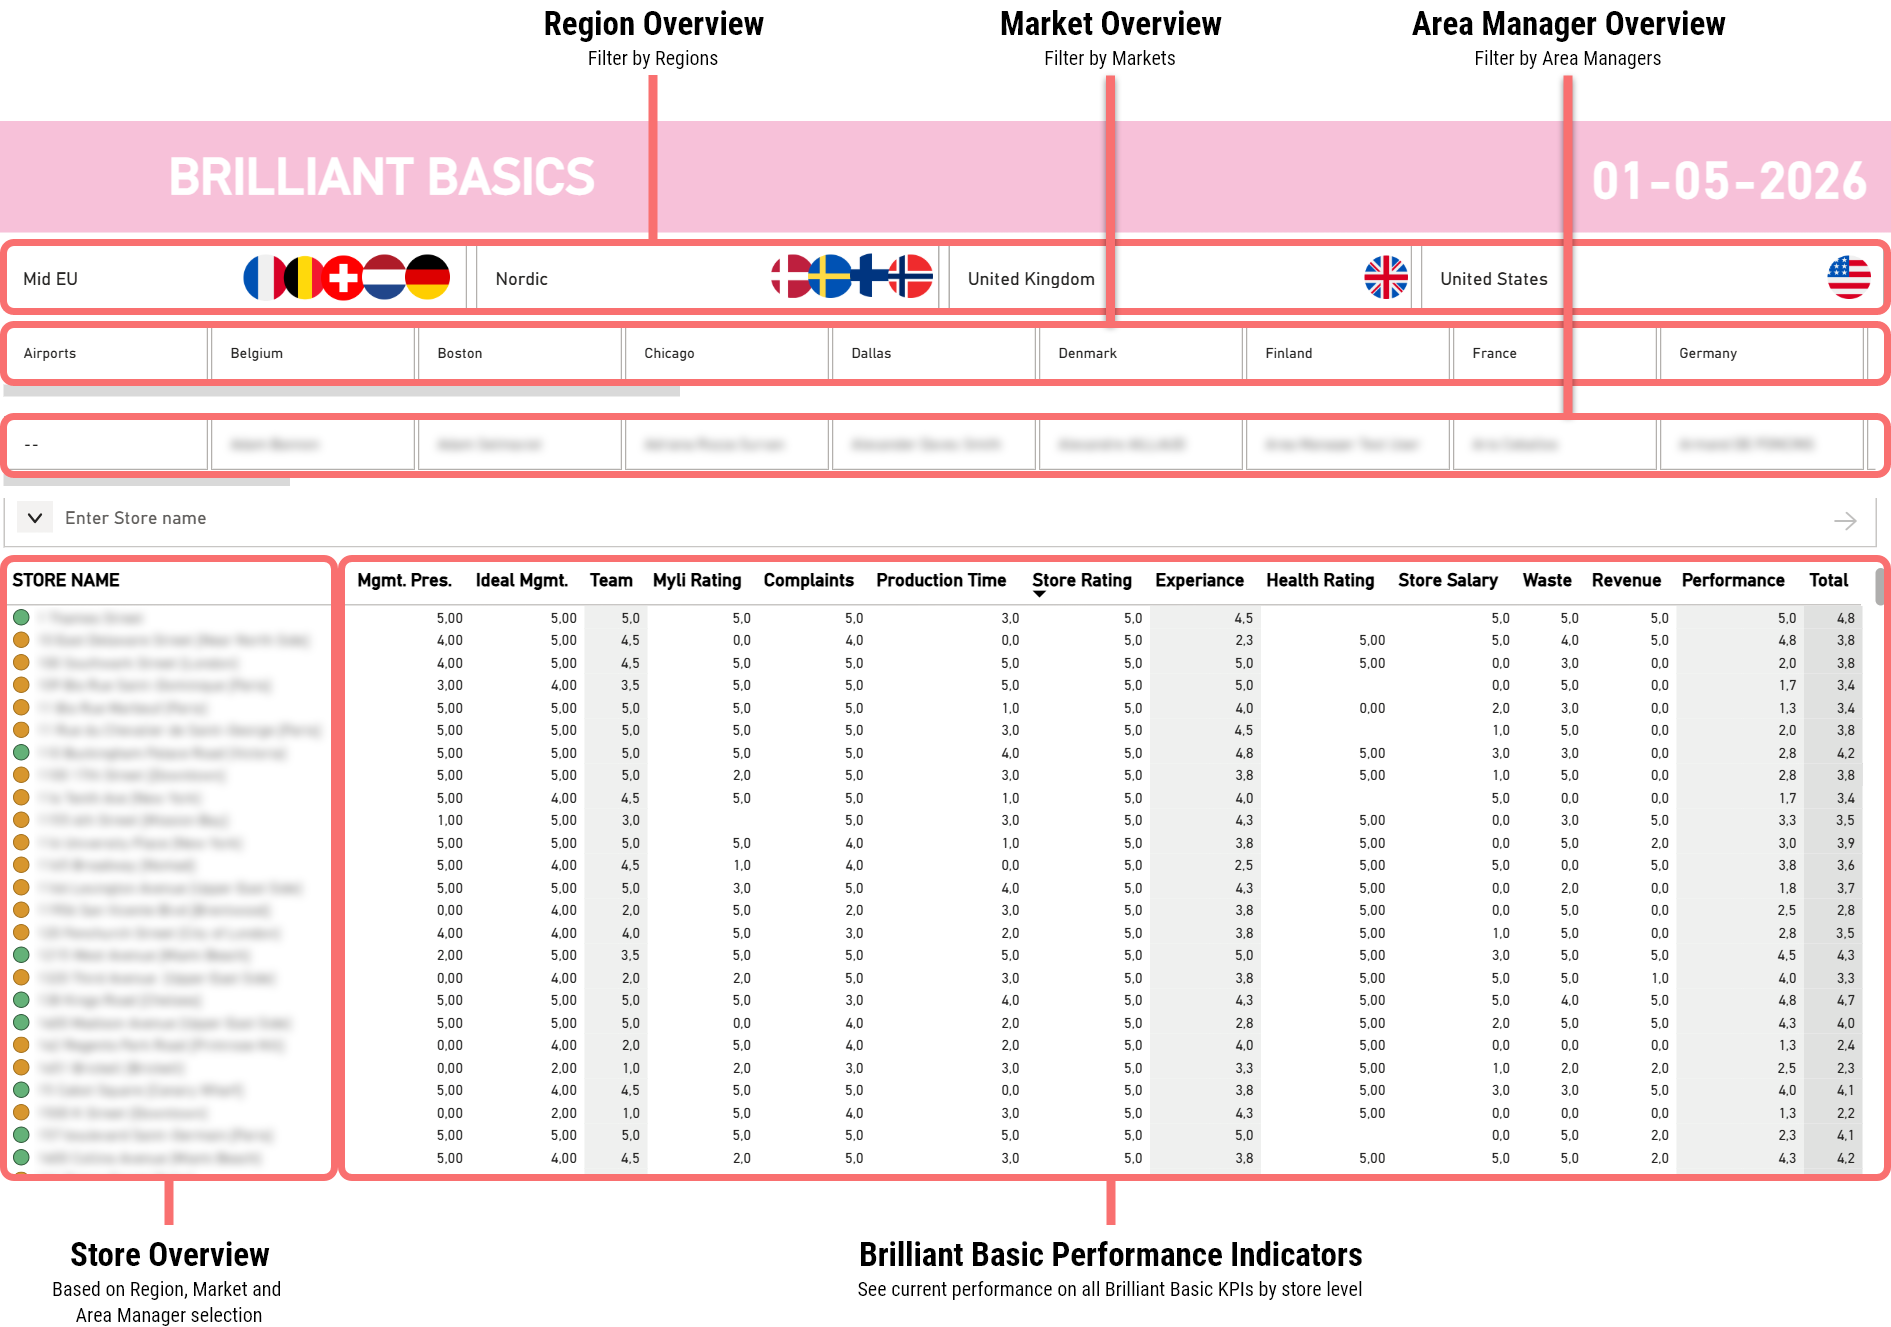
Bottom Level: Store Leadership
The Store Performance Dashboard gives store managers a detailed breakdown of their own scores across all sub-parameters, month by month. As months pass, the view builds up to a rolling Last 12 Months (L12M) perspective, so trends are visible.
How to Read the Dashboard
Overall Score: Calculated assuming equal weight across all parameters (Experience, Performance, Team).
Monthly Development: Each new month is added progressively until the view reaches L12M.
Regional Overview: Number of Brilliant Basics stores vs. total stores, shown as a percentage.
The dashboard is built into Regional Management Packs and reviewed regularly to ensure consistent follow-up at every level of the organisation.
How to read and deep-dive Management Presence
Global Level
Regional Level
Market Level
IMS Sheets
Find your markets IMS Sheets here
Validation Checklist
Find your markets Validation Checklist here
The Training Toolbox
What Is the Training Toolbox?
The Training Toolbox is the practical companion to the Score Card and Dashboard. For every metric that a store is scored on, the toolbox maps the exact training modules and in-store tools available to improve performance. It answers the question: "My score is low on this metric, what do I do about it?"
The toolbox is organised by parameter and sub-parameter, with clear success criteria, targets, key in-store behaviours, and direct links to the relevant training.
The Training Toolbox can be downloaded here.
How to Use the Training Toolbox
Step 1: Identify the metric you want to improve.
Use the Score Card or Dashboard to find where your store is scoring below 4. Pick one or two focus areas — do not try to fix everything at once.
Step 2: Open the relevant section of the toolbox.
Each metric has its own toolbox page with: the definition of the metric, the target score, the key parameters that drive that metric in-store, the training modules available, and the tools/reports to use.
Step 3: Assign training and actions.
Use the training modules listed to train yourself and your team. Use the tools and reports to measure progress and follow up.
Step 4: Follow up.
Return to the Dashboard the following month to check whether the score has moved. Repeat the cycle.
Case Example: Assess, Identify, and Act
Which Metric Do You Fix First?
MEET JOE
Joe has been Store Manager for four months. He opens his monthly Brilliant Basics Dashboard and finds an overall score of 3.4, below the 4.01 needed for Brilliant Basics status.
Gaps show up across all three pillars, which is normal. The job now is not to fix everything. It is to choose where one or two weeks of focused effort will move the score the most.
HIS MONTHLY DASHBOARD
OVERALL SCORE 3.4 · NOT YET BRILLIANT BASICS
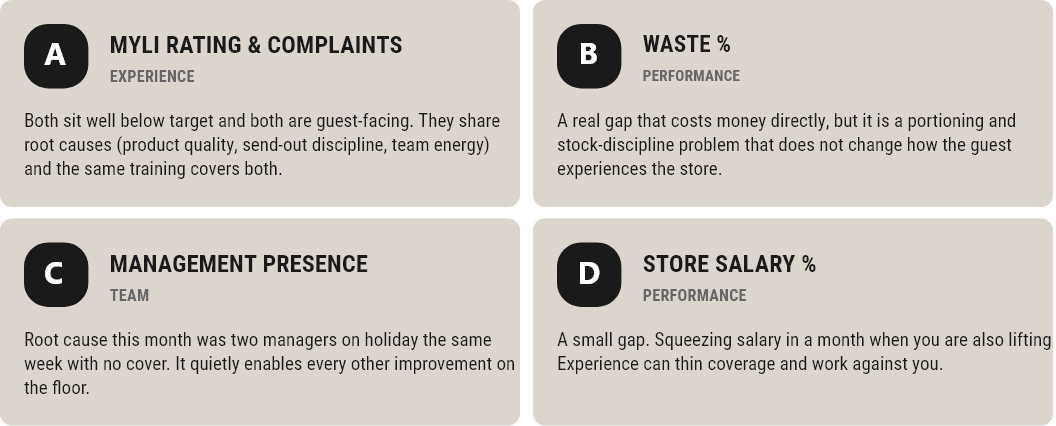
You cannot fix all six at once. Decide where Joe should put his focus this month.
YOUR TASK
Decide which focus area Joe should treat as primary this month, and why. For the ones you set aside, explain what made you deprioritise them rather than ignore them.
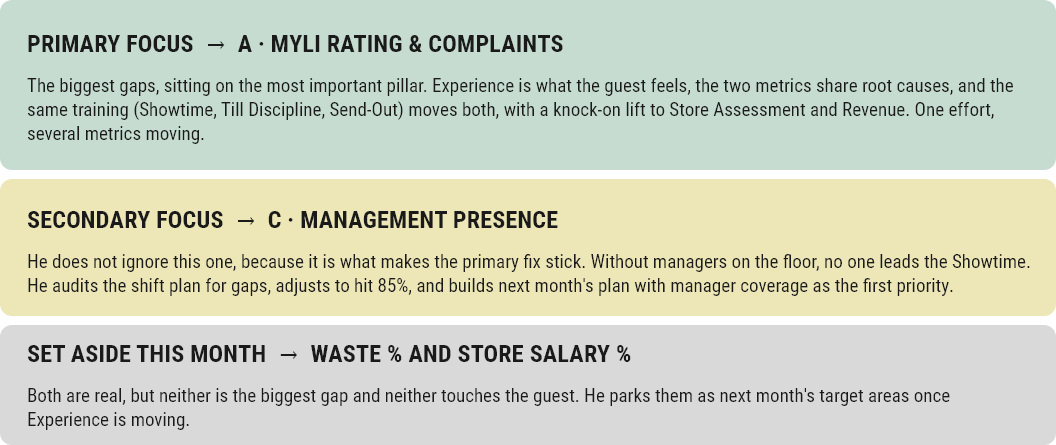
THE ANSWER JOE REACHES
IMS Sheets
Find your markets IMS Sheets here
Validation Checklist
Find your markets Validation Checklist here
The following example walks through how a store leader would use the three core steps in practice.
Step 1: Assess Performance
Scenario: You are a store manager reviewing your store's monthly Dashboard scores.
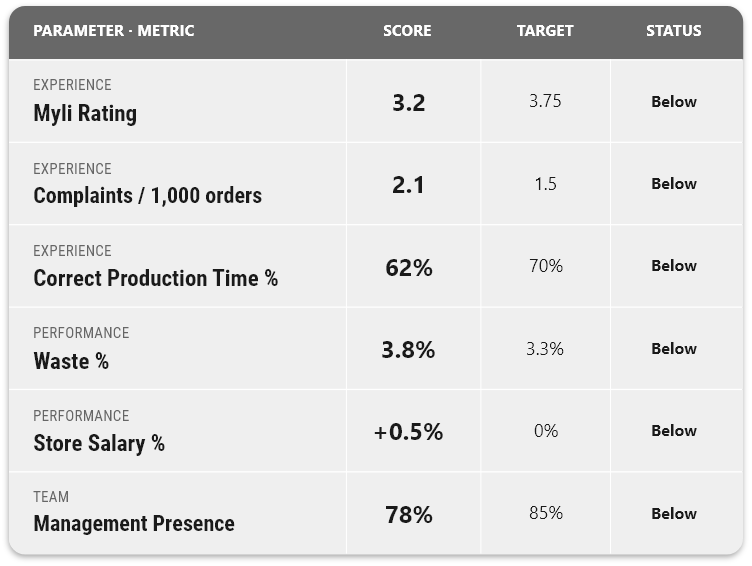
Your current scores are:
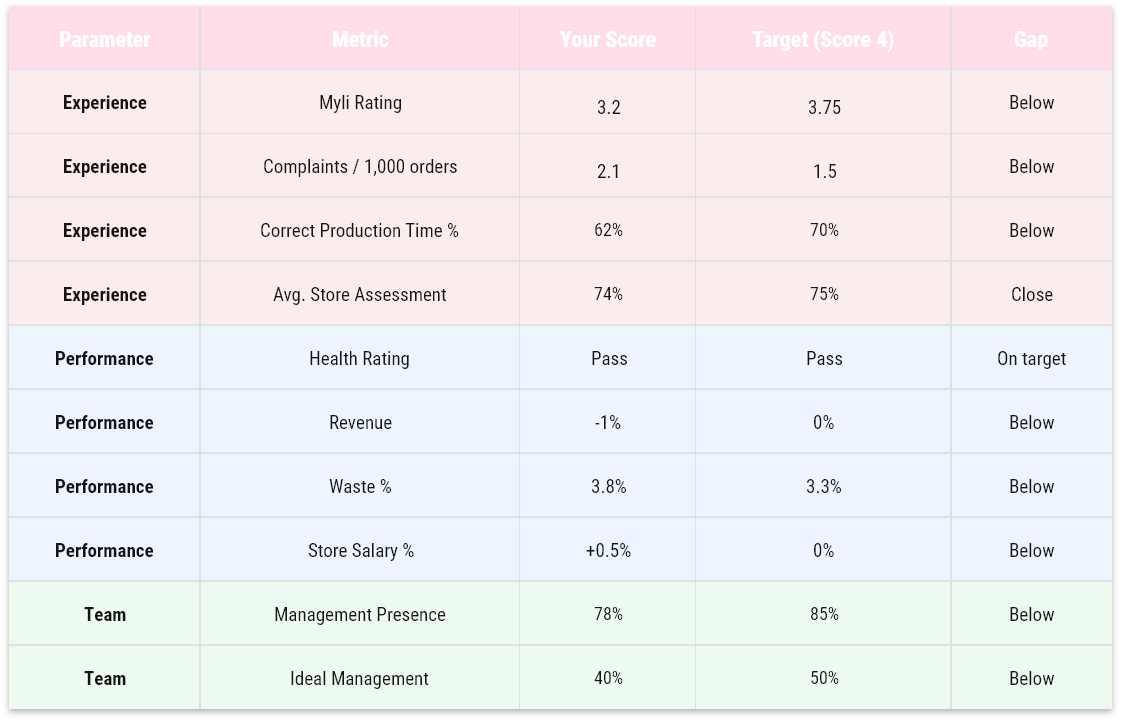
Overall score: 3.4 - not yet Brilliant Basics.
You have gaps across multiple areas, which is common. The next step is to prioritise.
Step 2: Identify the Area of Improvement
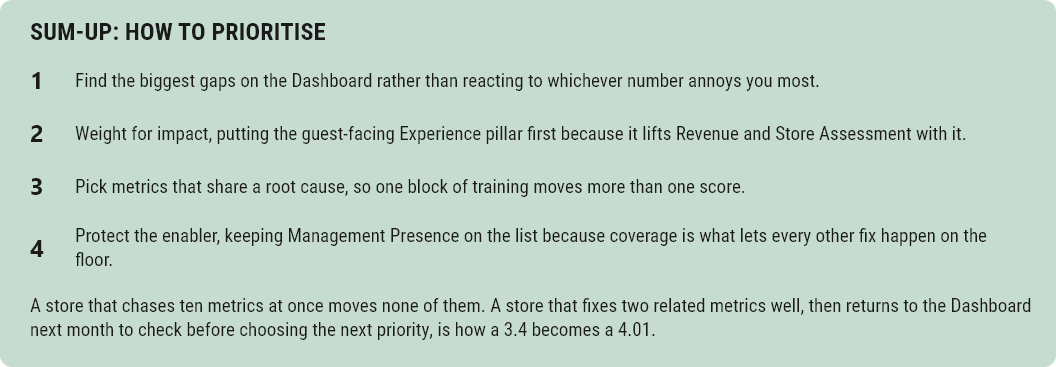
With limited time and energy, you cannot fix everything at once. You use the following logic to prioritise:
Biggest gaps: Myli Rating (3.2 vs 3.75), Complaints (2.1 vs 1.5), Management Presence (78% vs 85%), and Waste % (3.8% vs 3.3%) all show meaningful gaps.
Highest impact: Myli Rating and Complaints both fall under Experience. Experience is guest-facing and directly impacts the brand. Improving these will also likely improve Revenue. You decide to focus on Experience as your primary area, specifically Myli Rating and Complaints.
Why these two?
- They share root causes: product quality, send-out discipline, and team energy.
- Improving them requires the same training (Showtime, Till Discipline, Send-Out behaviours).
- A focused effort on experience will likely have a positive knock-on effect on the Store Assessment Rating as well.
Secondary focus: Management Presence (78% vs 85%) is a Team metric that also enables all other improvements — better manager coverage means better Showtime execution and better shift quality.
Step 3: Reference the Training Toolbox to Build an Action Plan
Using the toolbox, you build the following 4-week action plan:
Focus Area 1: Myli Rating and Complaints
Root cause identified: Through observing a few shifts, you notice that orders are occasionally sent out incomplete, juicers are not confirming names at send-out, and the energy on the bar drops during busy periods.
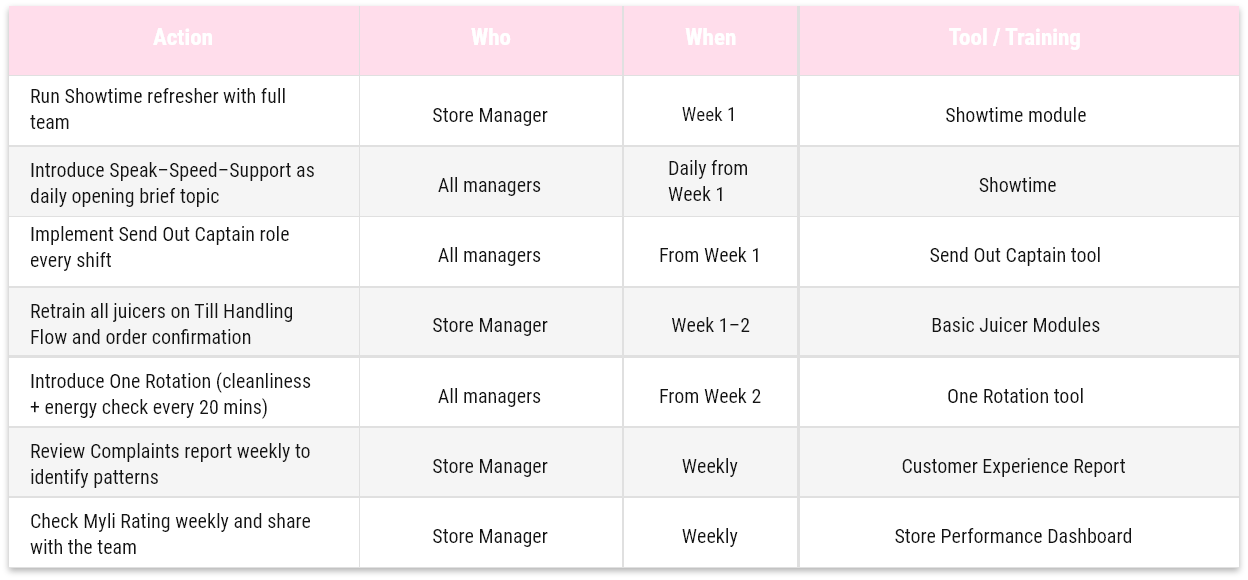
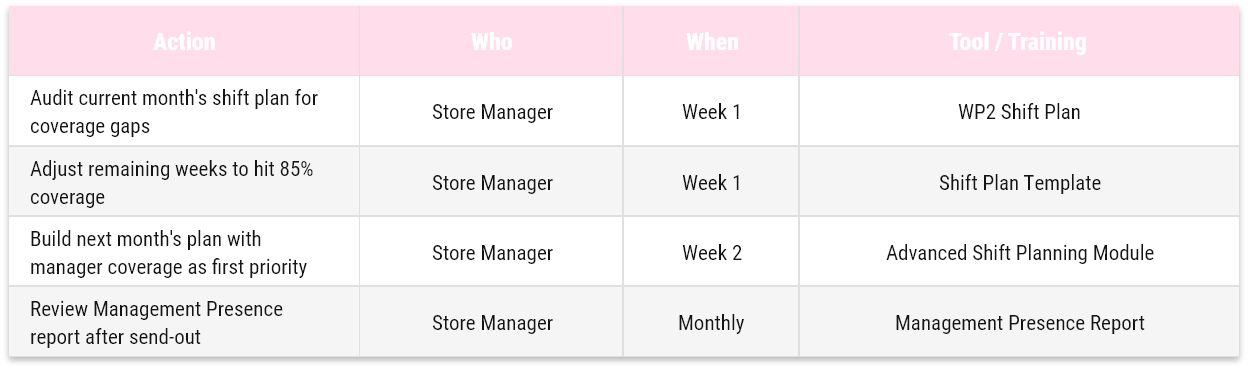
Focus Area 2: Management Presence
Root cause identified: Two managers have been on holiday in the same week, and the shift plan has not been adjusted to maintain coverage.
Step 4: Follow-up
At the end of the month, return to the Dashboard. Check whether Myli Rating, Complaints, and Management Presence have moved. If they have improved, maintain the behaviours and shift focus to the next priority area (Waste % or Salary %). If not, review execution and adjust.


Checklist
Find your markets Checklist here
IMS Sheets
Find your markets IMS Sheets here
Validation Checklist
Find your markets Validation Checklist here


.png)


IMS Sheets
Find your markets IMS Sheets here
Validation Checklist
Find your markets Validation Checklist here


How to videos

IMS Sheets
Find your markets IMS Sheets here
Validation Checklist
Find your markets Validation Checklist here

Closing Tasks
Deep Clean Centrifuge

Closing Tasks
Espresso Machine Cleaning
IMS Sheets
Find your markets IMS Sheets here
Validation Checklist
Find your markets Validation Checklist here
Cleaning Tasks

Clean Seating and Tables

Clean Trash Bins in Customer Area

Clean Bar Bins

Clean Bar Lamps + Speakers

Clean Cleaning Tools

Clean Drains

Clean Floor Panels

Clean Ice Machine

Clean Sandwich Grills

Clean Walls and Pictures

Clean Fridges

Deep Clean Stockroom + Fridges

Clean Bar Filters

Clean Fruit Baskets

Clean Dishwasher

Clean Sinks

Clean Centrifuge Cave

Deep Clean GB5

Transport Wagons
Bar Cabinets
How to handle Cleaning Detergents

Dishwasher Detergent
Cafiza
Multipurpose
IMS Sheets
Find your markets IMS Sheets here
Validation Checklist
Find your markets Validation Checklist here

Prev
13/
4
IMS Sheets
Find your markets IMS Sheets here
Validation Checklist
Find your markets Validation Checklist here